Surface Potential Measurements with the Kelvin Probe Diagnostic
Advanced Diagnostics Navigation
- Atomic and molecular species, positive and negative ions
- Laser-Induced Fluorescence (LIF) and Two-Photon Absorption LIF (TALIF)
- Radar Resonant Enhanced Multi-Photon Ionization (Radar REMPI)
- Characterization of plasma, chemical composition and dynamic behavior
- Electron velocity distribution function, gas flow velocity and temperature
- Electric field and space potential
- Nanoparticle Diagnostics
- Surface Diagnostics
Surface Potential Measurements with the Kelvin Probe Diagnostic
Charging of components immersed within plasma occurs according to the fluxes of positive and negative plasma species. We study this phenomenon with a Trek 6000B-8 non-contacting voltmeter. During operation, the voltmeter is positioned over a charged substrate and reports surface voltages in the range of 0 to ±3000 Volts in 1 Volt increments.
The probe operates under the principle of an oscillating capacitor. As the probe’s needle-point tip oscillates in space, the voltage difference [katex] V[/katex] between the tip and the surface is maintained by a current [katex] I [/katex] delivered to the probe tip. The time rate of change of the probe-surface capacitance is given by
\frac{dQ}{dt} = \frac{dC}{dt}V \implies I = - \frac{\varepsilon \varepsilon_0 A}{\left(D_0 + D_1(t)\right)^2 }\frac{dD_1(t)}{dt}Vwhere [katex] D_0[/katex] is the mean distance between the surface and probe, [katex]D_1(t)[/katex] is the oscillation distance of the probe tip, [katex]A[/katex] the area of the probe tip, and [katex]\varepsilon[/katex] and [katex]\varepsilon_0[/katex] the permittivity of the surrounding media and free space. By observing the current supplied to the probe and driving the oscillation, the voltage [katex]V[/katex] of the surface relative to the probe can be calculated.
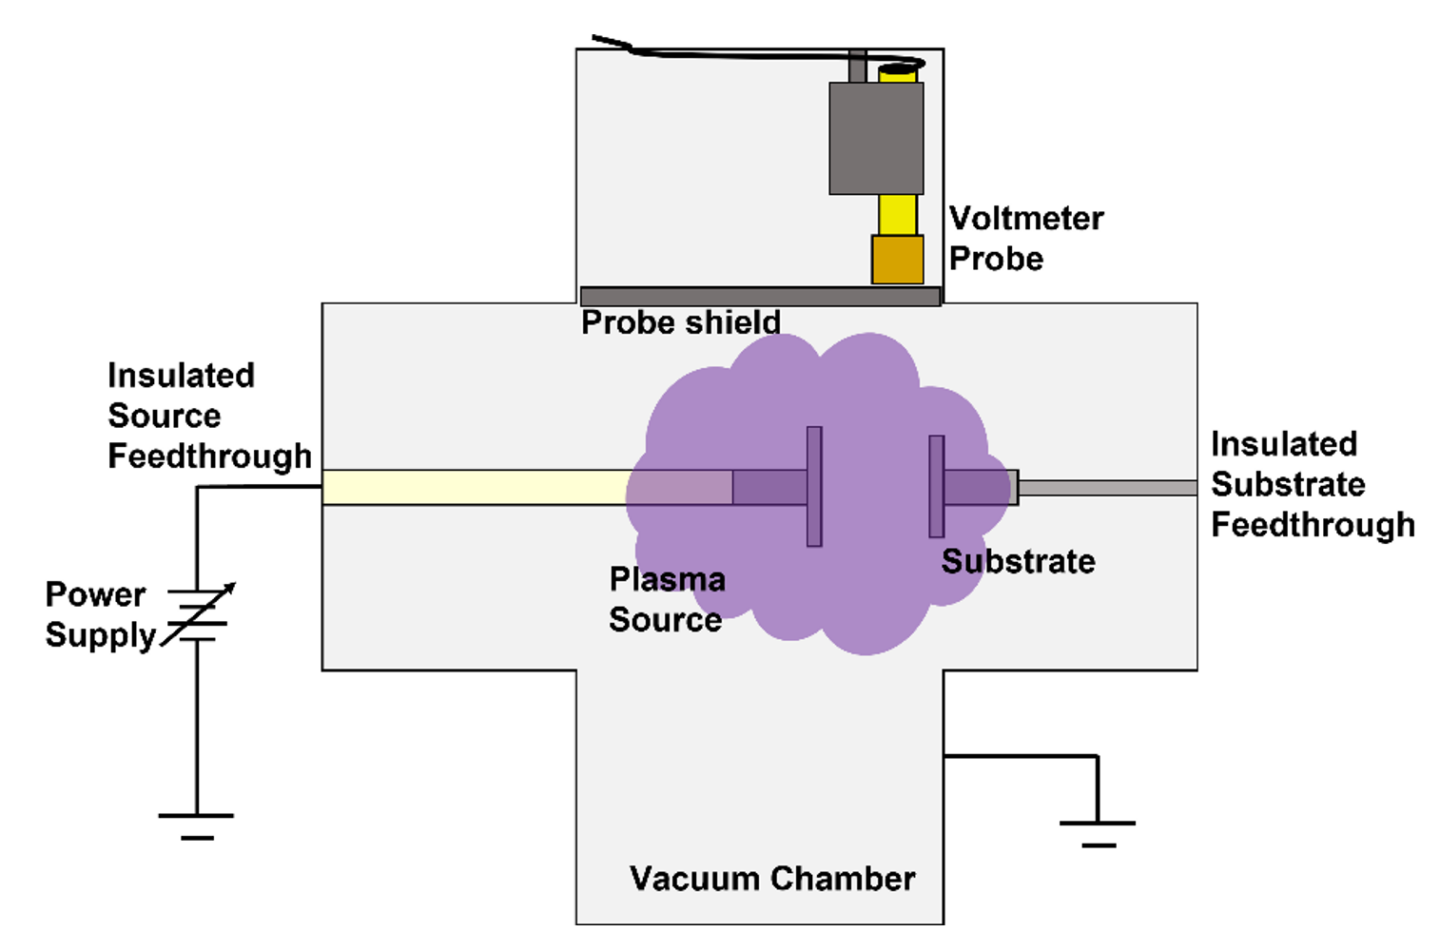
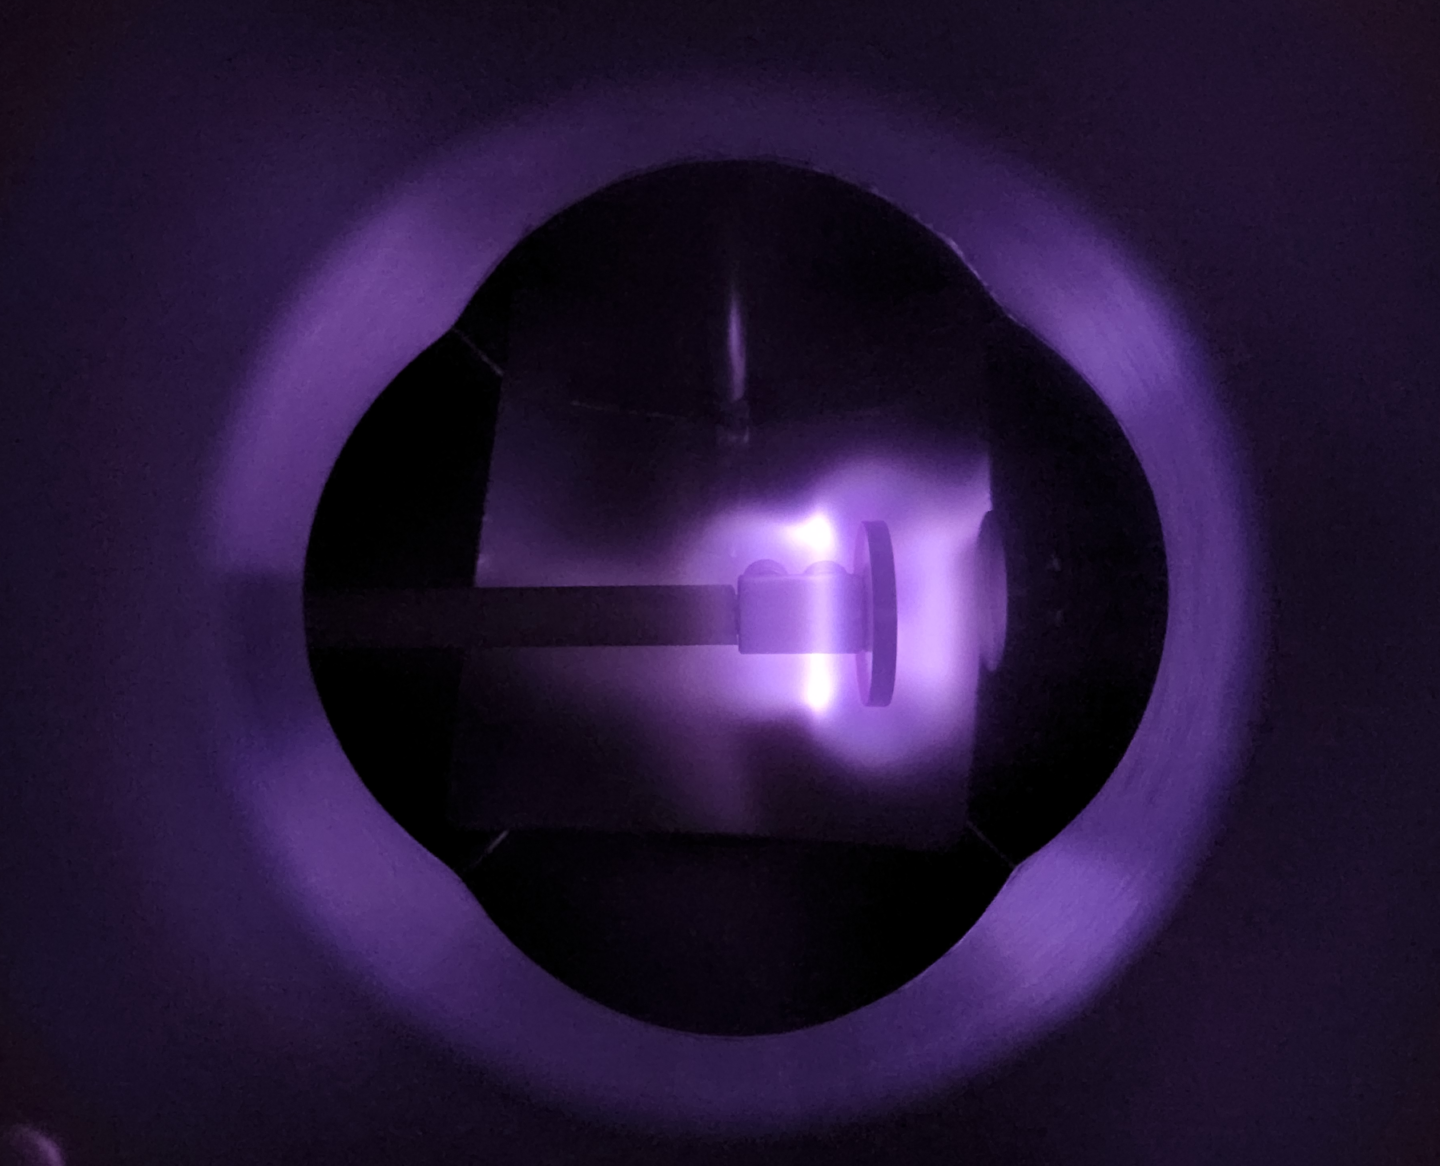
In one setup (Fig. 1) we measure the charge delivered to a dielectric substrate by a DC glow discharge. Results of one such measurement are given in Figure 2.


Figure 1a: System when plasma is ignited and charging the substrate. Diagram (top), image during operation (bottom).


Figure 1b: System when plasma is off and voltmeter probe is measuring surface charge. Diagram (top), image during operation (bottom).

Figure 2: Example of a surface charge measurement in a 200 mTorr Plasma.
 This capability is located at the Princeton Plasma Physics Laboratory.
